A simple solution for monitoring ML systems.
This blog post aims to provide a simple, open-source solution for monitoring ML systems. We'll discuss industry-standard monitoring tools and practices for software systems and how they can be adapted to monitor ML systems.

This blog post aims to provide a simple, open-source solution for monitoring ML systems. We'll discuss industry-standard monitoring tools and practices for software systems and how they can be adapted to monitor ML systems.
To illustrate this, we'll use a scikit-learn model trained on the UCI Wine Quality dataset and served via FastAPI (see Github repo here). We'll collect metrics from the server using Prometheus and visualize the results in a Grafana dashboard. All of the services will be deployed on a Kubernetes cluster; if you're not familiar with Kubernetes, feel free to take a quick read through my introduction to Kubernetes blog post.
Overview
- Why is monitoring important?
- What should we be monitoring?
- Monitoring a wine quality prediction model: a case study.
- Going beyond a simple monitoring solution
- Best practices for monitoring
- Resources
Why is monitoring important?
It's a well-accepted practice to monitor software systems so that we can understand performance characteristics, react quickly to system failures, and ensure that we're upholding our Service Level Objectives.
Monitoring systems can help give us confidence that our systems are running smoothly and, in the event of a system failure, can quickly provide appropriate context when diagnosing the root cause.
When deploying machine learning models, we still have the same set of concerns discussed above. However, we'd also like to have confidence that our model is making useful predictions in production.
There are many reasons why a model can fail to make useful predictions in production:
- The underlying data distribution has shifted over time and the model has gone stale.
- The production data stream contains edge cases (not seen during model development) where the model performs poorly.
- The model was misconfigured in its production deployment.
In all of these scenarios, the model could still make a "successful" prediction from a service perspective, but the predictions will likely not be useful. Monitoring our machine learning models can help us detect such scenarios and intervene (e.g. trigger a model retraining/deployment pipeline).
What should we be monitoring?
At a high level, there's three classes of metrics that we'll want to track and monitor.
Model metrics
- Prediction distributions
- Feature distributions
- Evaluation metrics (when ground truth is available)
System metrics
- Request throughput
- Error rate
- Request latencies
- Request body size
- Response body size
Resource metrics
- CPU utilization
- Memory utilization
- Network data transfer
- Disk I/O
Monitoring a wine quality prediction model: a case study.
Throughout the rest of this blog post, we'll walk through the process of instrumenting and monitoring a scikit-learn model trained on the UCI Wine Quality dataset. This model is trained to predict a wine's quality on the scale of 0 (lowest) to 10 (highest) based on a number of chemical attributes.
At a high level, we'll:
- Create a containerized REST service to expose the model via a prediction endpoint.
- Instrument the server to collect metrics which are exposed via a separate metrics endpoint.
- Deploy Prometheus to collect and store metrics.
- Deploy Grafana to visualize the collected metrics.
- Finally, we'll simulate production traffic using Locust so that we have some data to see in our dashboards.
Feel free to clone this Github repository and follow along yourself. All of the instructions to deploy these components on your own cluster are provided in the README.md file.
Deploying a model with FastAPI
If you look in the model/ directory of the repo linked previously, you'll see a couple files.
train.pycontains a simple script to produce a serialized model artifact.app/api.pydefines a few routes for our model service including a model prediction endpoint and a health-check endpoint.app/schemas.pydefines the expected schema for the request and response bodies in the model prediction endpoint.Dockerfilelists the instructions to package our REST server as a container.
We can deploy this server on our Kubernetes cluster using the manifest defined in kubernetes/models/.
Instrumenting our service with metrics
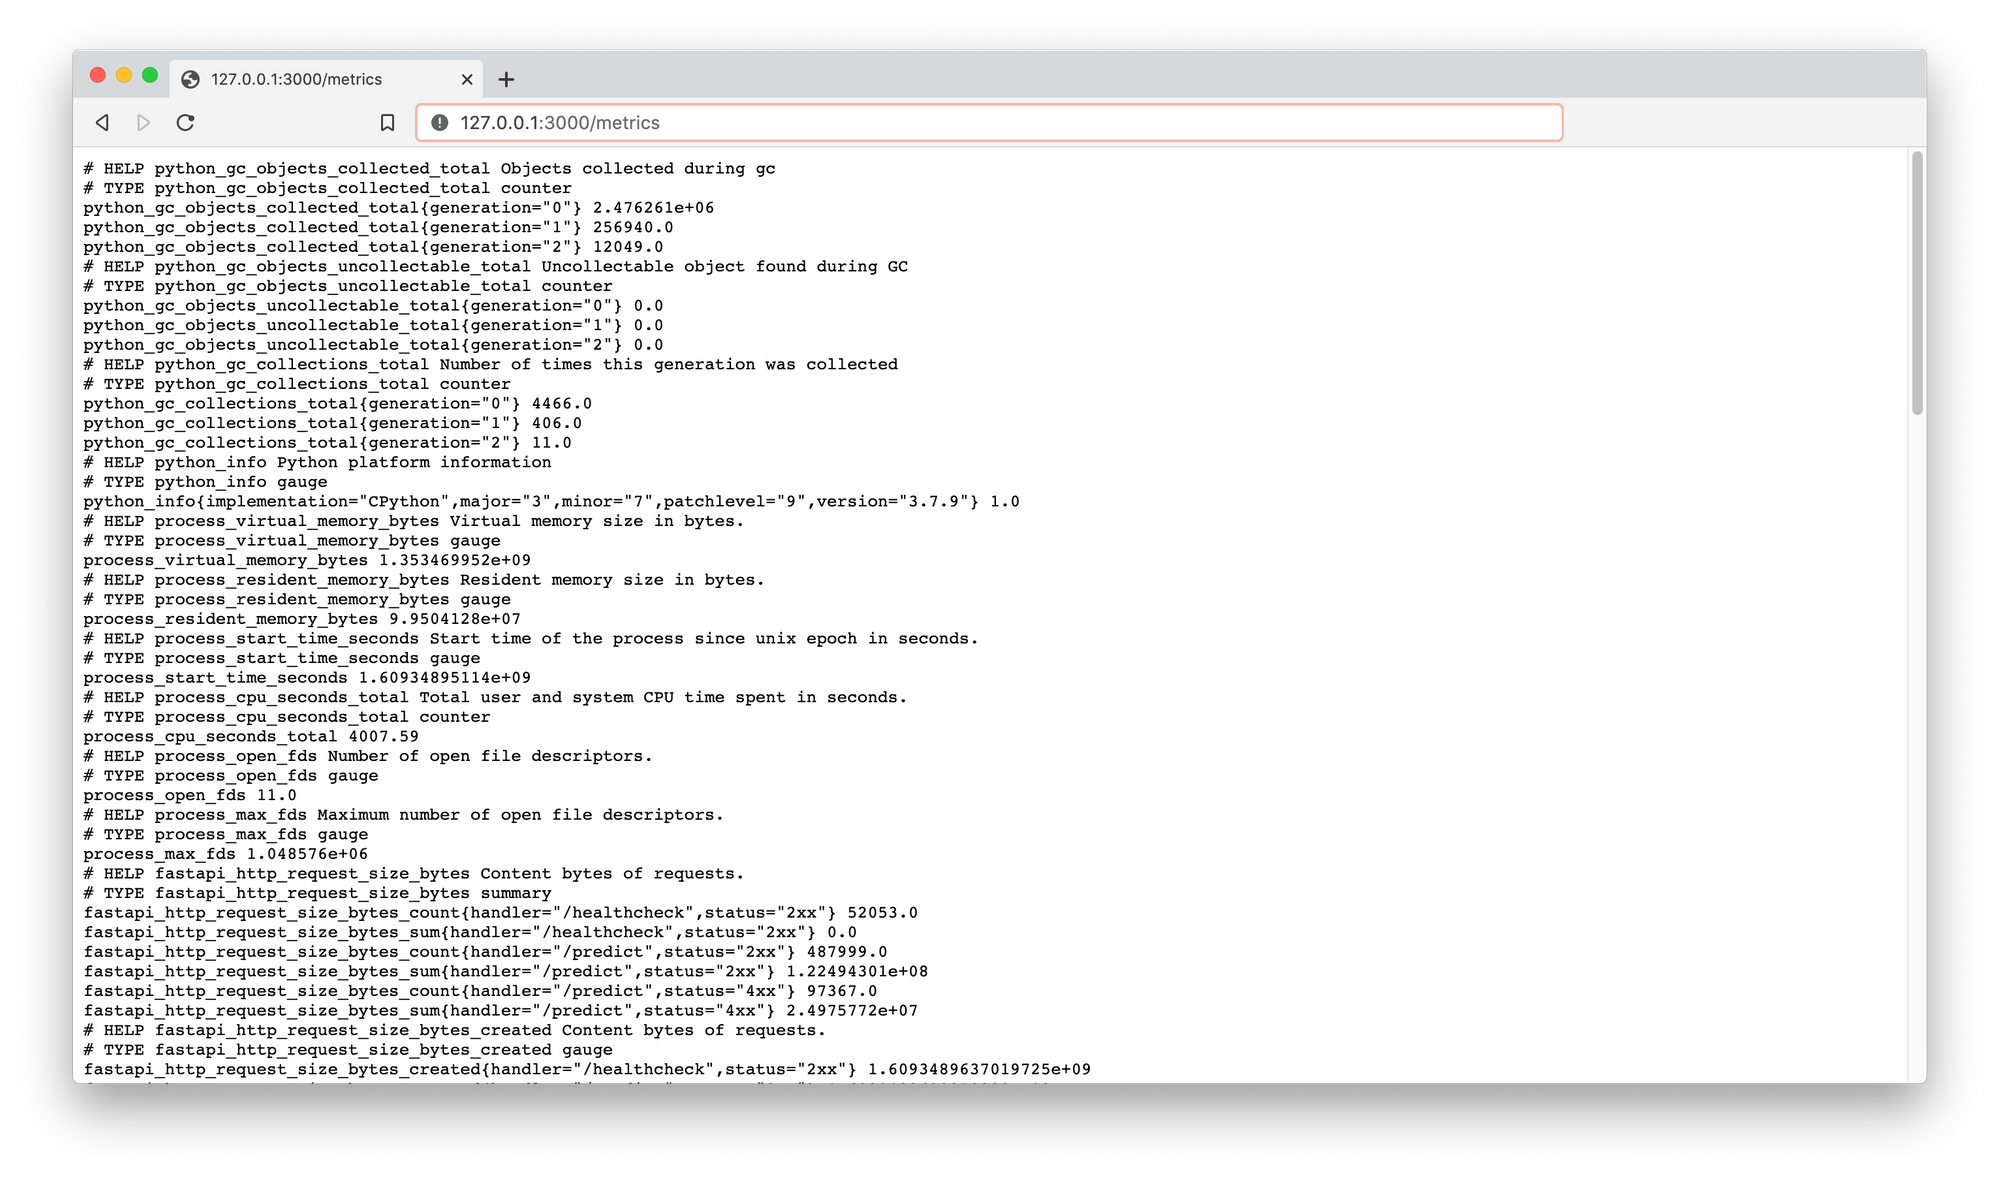
In order to monitor this service, we'll need to collect and expose metrics data. We'll go into more details in the subsequent section, but for now our goal is to capture "metrics" and expose this data via a /metrics endpoint on our server.
For FastAPI servers, we can do this using prometheus-fastapi-instrumentator. This library includes FastAPI middleware that collects metrics for each request and exposes the metric data to a specified endpoint.
For our example, we'll capture some of the metrics included in the library (request size, response size, latency, request count) as well as one custom-defined metric (our regression model's output). You can see this configuration defined in model/app/monitoring.py.
After deploying our model service on the Kubernetes cluster, we can port forward to a pod running the server and check out the metrics endpoint running at 127.0.0.1:3000/metrics.
kubectl port-forward service/wine-quality-model-service 3000:80
Note: many of the framework-specific serving libraries offer the ability to expose a metrics endpoint out of the box. However, I'm not sure how you can define custom (model-specific) metrics to be logged using these serving platforms.
Capturing metrics with Prometheus
After exposing our metrics at a specified endpoint, we can use Prometheus to collect and store this metric data. We'll deploy Prometheus onto our Kubernetes cluster using helm, see the Setup section in the README.md file for full instructions.
Prometheus is an open-source monitoring service with a focus on reliability. It is responsible for collecting metrics data from our service endpoints and efficiently storing this data to be later queried.
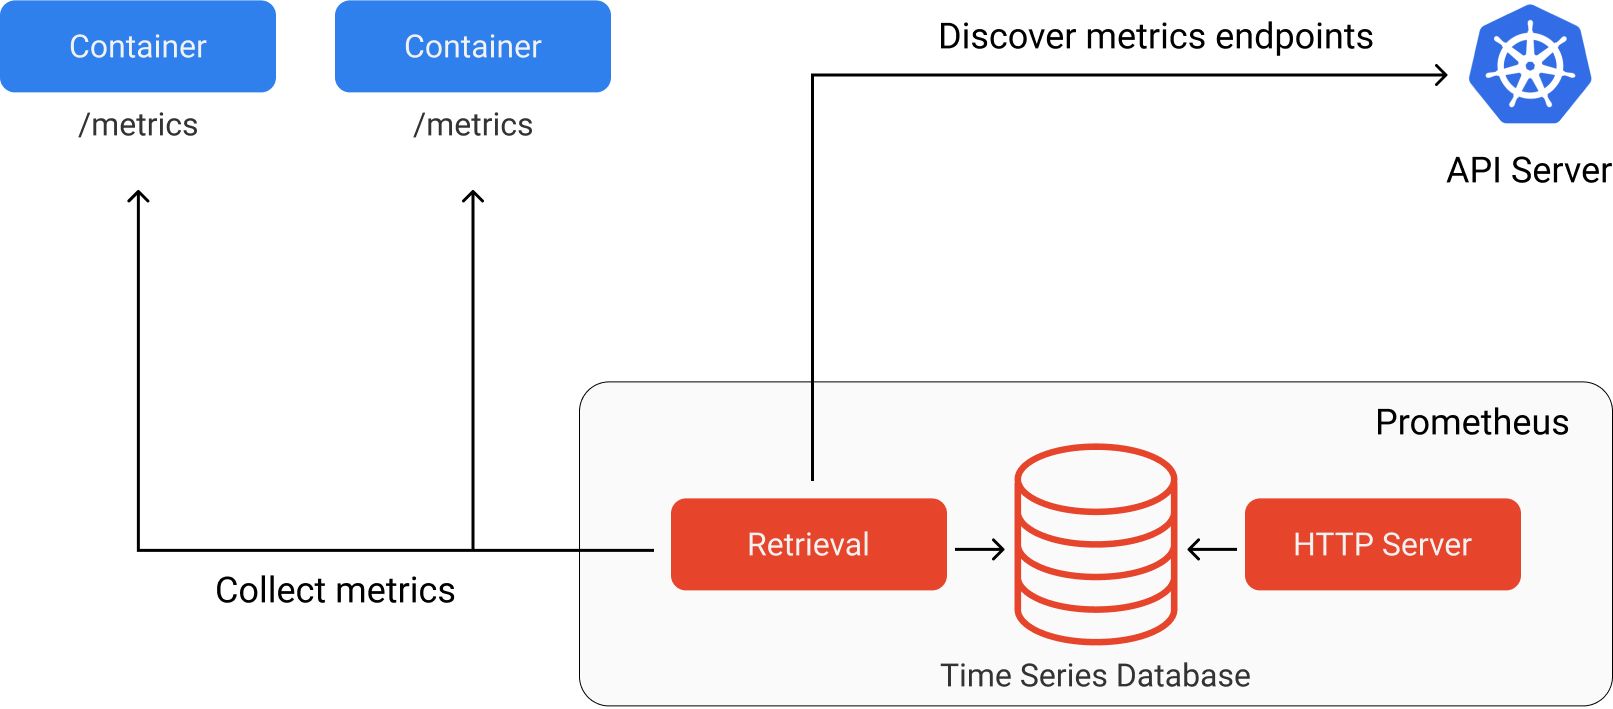
Prometheus refers to endpoints containing metric data as targets which can be discovered either through service discovery or static configuration. In our example, we'll use service discovery to enable Prometheus to discover which targets should be scraped. We can do this by creating a ServiceMonitor resource for our wine quality prediction service. This resource specification is included in the kubernetes/models/wine_quality.yaml manifest. This resource must be defined in the same namespace that Prometheus is running in.
You can see all of the services configured to be discovered by Prometheus by running:
kubectl get servicemonitor -n monitoring
You'll notice that in addition to collecting metrics from our wine quality prediction service, Prometheus has already been configured to collect metrics from the Kubernetes cluster itself.
Prometheus will scrape the metrics data at each of these endpoints at a specified interval (every 15 seconds by default). There are four supported data types for metrics.
- Counter: a single value that monotonically increases over time (e.g. for counting number of requests made)
- Gauge: a single value that can increase or decrease over time (e.g. for tracking current memory utilization)
- Summary: a collection of values aggregated by
countandsum(e.g. for calculating average request size) - Histogram: a collection of values aggregated into buckets (e.g. for tracking request latency)
You can read more about these metric types here. Each metric has a name and an optional set of labels (key-value pairs) to describe the observed value. These metrics are designed such that they can be aggregated at different timescales for more efficient storage. This metric data can be queried by other services (such as a Grafana) which make requests to the HTTP server.
Note: Prometheus uses a PULL mechanism for collecting metrics, where services simply expose the metrics data at an endpoint and Prometheus collects the data. Some other monitoring services (e.g. AWS CloudWatch) use a PUSH mechanism where each service collects and sends its own metrics to the monitoring server. You can read about the tradeoffs for each approach here.
Visualizing results in Grafana
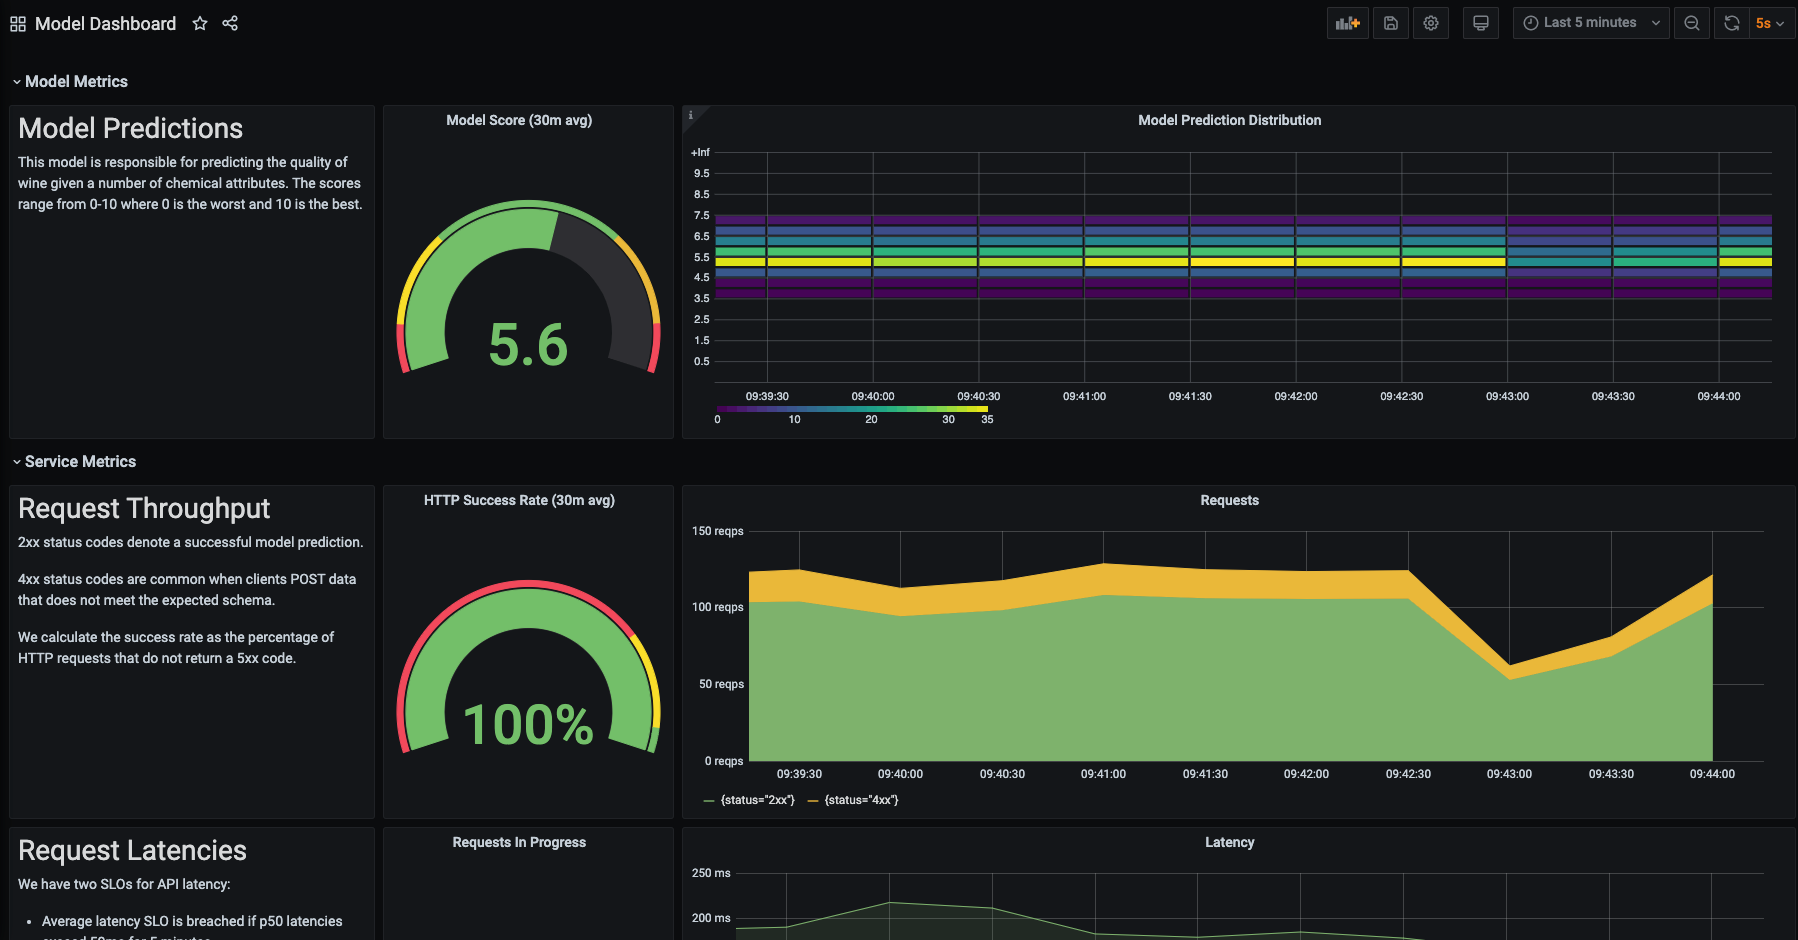
Now that our metrics are being collected and stored in Prometheus, we need a way to visualize the data. Grafana is often paired with Prometheus to provide the ability to create dashboards from the metric data. In fact, our helm install of the Prometheus stack included Grafana out of the box.
You can check out the Grafana dashboard by port-forwarding to the service and visiting 127.0.0.1:8000.
kubectl port-forward service/prometheus-stack-grafana 8000:80 -n monitoring
We can create visualizations by making queries to the Prometheus data source. Prometheus uses a query language called PromQL. Admittedly, it can take some time to get used to this query language. After reading through the official documentation, I'd recommend watching PromQL for Mere Mortals to get a better understanding of the query language.
The repository for this blog post contains a pre-built dashboard (see dashboards/model.json) for the wine quality prediction service which you can import and play around with.
Simulating production traffic with Locust
At this point, we have a model deployed as a REST service which is instrumented to export metric data. This metric data is being collected by Prometheus and we can visualize the results in a Grafana dashboard. However, in order to see something interesting in the dashboard we'll want to simulate production traffic.
We'll use locust, a Python load testing framework, to make requests to our model service and simulate production traffic. This behavior is defined in load_tests/locustfile.py where we define three tasks:
- make a request to our health check endpoint
- choose a random example from the wine quality dataset and make a request to our prediction service
- choose a random example from the wine quality dataset, corrupt the data, and make a bad request to our prediction service
The manifests to deploy this load test to our cluster can be found in kubernetes/load_tests/.
Going beyond a simple monitoring solution
In the wine quality prediction model case study, we only tracked a single model metric: the prediction distributions. However, as I mentioned previously there's more model-related metrics that we may want to track such as feature distributions and evaluation metrics.
These remaining concerns introduce a few new challenges:
- The Prometheus time series database was designed to store metric data, not features for ML models. This is not the right technology choice to store feature data for tracking their fluctuations over time.
- Model evaluation metrics require a feedback signal containing the ground truth which is not available at inference time.
When it comes to logging feature distributions, there's a range of approaches you can take. The simplest approach for monitoring feature distributions might be to deploy a drift-detection service alongside the model. This service would fire (and increase a counter metric) when feature drift is detected.
For additional visibility into your production data, you can log a statistical profile of the features observed in production. This allows for a compact summary of data observed in production and can help you identify when data distributions are shifting. The information logged will vary depending on the type of data:
- For tabular data, you can directly log features used through statistical measures such as histograms and value counts.
- For text data, you can log metadata about the text such as character length, count of numeric characters, count of alphabetic characters, count of special characters, average word length, etc.
- For image data, you can log metadata about the image such as average pixel value per channel, image width, image height, aspect ratio, etc.
For full visibility on your production data stream, you can log the full feature payload. This is not only useful for monitoring purposes, but also in data collection for labeling and future model training. If your deployment stack already supports saving production data, you can leverage this data source (typically a data lake) for monitoring whether or not the production data distribution is drifting away from the training data distribution.
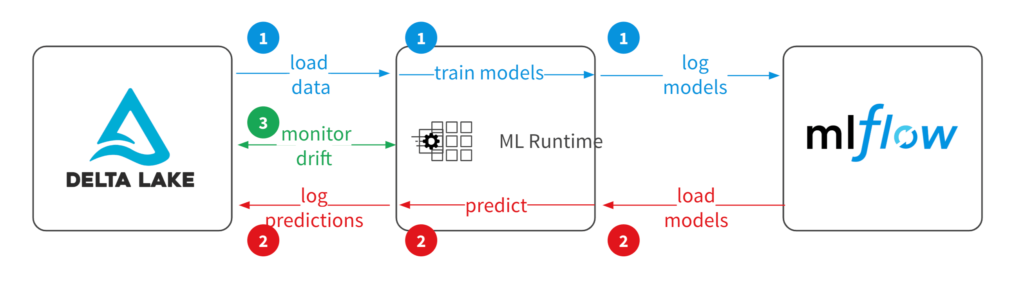
In order to monitor model evaluation metrics, we'll need to persist model prediction results alongside a unique identifier which is included in the model inference response. This unique identifier will be used when we asynchronously receive feedback from the user or some upstream system regarding a prediction we made. Once we've received feedback we can calculate our evaluate metric and log the results via Prometheus to be displayed in the model dashboard.
Purpose-built monitoring tools for ML models
If you're looking for out-of-the-box support for some of these more advanced model monitoring use cases, there's a growing number of ML monitoring services that you can use.
WhyLogs is an open-source library for capturing statistical profiles of production data streams.
Seldon has developed an open-source library which runs on Kubernetes and uses a similar technology stack (Prometheus, Grafana, Elasticsearch) as discussed in this blog post.
Fiddler offers a slick monitoring product with a dashboard built specifically for monitoring models and understanding predictions on production data. Check out this pull request to see how I integrated Fiddler with the wine quality prediction model from this blog post.
Amazon Sagemaker offers a model monitoring suite which integrates well if you're already deploying models on Sagemaker.
Best practices for monitoring
Prometheus
- Avoid storing high-cardinality data in labels. Every unique set of labels for is treated as a distinct time series, high-cardinality data in labels can drastically increase the amount of data being stored. As a general rule, try to keep the cardinality for a given metric (number of unique label-sets) under 10.
- Metric names should have a suffix describing the unit (e.g.
http_request_duration_seconds) - Use base units when recording values (e.g. seconds instead of milliseconds).
- Use standard Prometheus exporters when available.
Grafana
- Ensure your dashboards are easily discoverable and consistent by design.
- Use template variables instead of hardcoding values or duplicating charts.
- Provide appropriate context next to important charts.
- Keep your dashboards in source control.
- Avoid duplicating dashboards.
Resources
Blog posts
- Production Machine Learning Monitoring: Outliers, Drift, Explainers & Statistical Performance
- Monitoring Machine Learning Models in Production: A Comprehensive Guide
- whylogs: Embrace Data Logging Across Your ML Systems
- Building dashboards for operational visibility
- How to Make Dashboards Using a Product Thinking Approach
- How does a Prometheus Histogram work?
Talks
- Fool-Proof Kubernetes Dashboards for Sleep-Deprived Oncalls - David Kaltschmidt
- How Prometheus Monitoring works | Prometheus Architecture explained
- PromQL for Mere Mortals
Acknowledgements
Thanks to Goku Mohandas, John Huffman, Shreya Shankar, and Binal Patel for reading early drafts of this blog post and providing feedback.